
|
 |
|
|---|
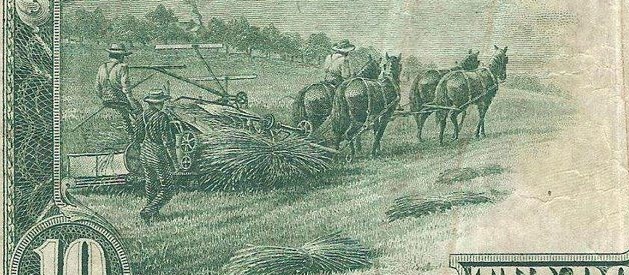
Part of a 1914 Federal Reserve Note Showing Hemp-Farming
THE ECONOMIC IMPACT TO OKLAHOMA'S TAX REVENUES
OF LEGALIZING MARIJUANA IN OKLAHOMA
6.0 - LEGALIZATION ITS POSITIVE IMPACT
On State Finances:
Now that weve looked at the negative impact (estimated at some $10-Million dollars), we shall now look at its positive impact upon state tax revenues. Please keep in mind that in some cases the numbers involved reflect completely NEW TAX revenues to be seen by the state, while at other times, the figures only reflect (direct) TAX SAVINGS to existing programs. And as the reader will soon be made aware, there is a big difference between a TAX SAVINGS and NEW TAX REVENUES received. But in both cases, we assume NO NEW TAX INCREASES above their present levels.
6.1 - DIRECT SALES TAX REVENUES (Marihuana Clubs)
Although there has been much talk about the millions and millions of dollars brought in to Colorado as a direct result of legalization. This report estimates that the State of Oklahoma will only be able to collect a total of around twenty-seven million dollars per year in direct sales tax revenues.
| AMOUNT | OVERALL TOTALS | |
| $27,000,000 | $17,000,000 |
METHODOLOGY
It is assumed that like Colorado, Oklahoma will also adopt a special sales tax (similar to the ones we now have on tobacco, alcohol, gambling activities, etc.,) which will bring in tax reviews in excess of the normal sales tax. However, predicting an exact figure was/is, to say the least, difficult.
While many have pointed to Colorado (the first state in this area to go legal), which figuratively speaking has made a killing in tax revenues out of it. We must not ignore several factors, unique to Colorado, which will effect our own states tax reviews.
- First, unlike Colorado, we will not have the Magnet Effect working for us. Simply put, Colorado was already a fun tourist place to begin with, and legalizing marijuana simply gave tourists yet one more reason to go there. -- And granted, let us say that we legalize but Texas does not. Then yes, for some period of time, Texans will travel over the state lines to buy legal Marihuana here. However it must be assumed that Texas itself will also legalize and probably around the same time that we do.
- Next, there are those who claim that by simply taking the number of estimated cannabis users residing within the state, that a financial figure can thus be extrapolated. However, this ignores the reality that ONCE LEGAL, the number of marijuana users drops and drops steadily.
- Then there is yet another problem. While one is tempted to just say we can simply raise taxes to raise more revenue, one must never forget the Laugherhy Curve (next page), which while its exact interpretation is disagreed upon, is universally accepted. For those of you who have never seen the curve before, it can best be summed up as follows:
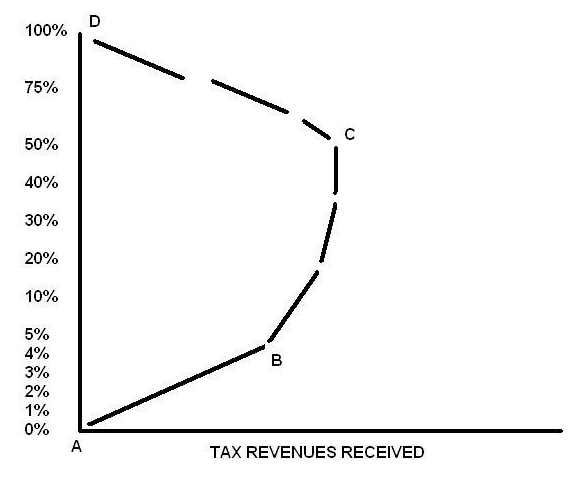
Reference the chart:
The lower horizontal line represents tax revenues collected. Their exact value is irrelevant, what is important is that the further to the right they go the more tax revenue is collected. While the vertical left-hand line can represent many things, actual dollar-amount of taxes imposed on an object, the percentage of taxes leveled on income or profit or whatever. In our case we used percentages simply because they are easier to understand. - POINT A: - Represents the starting point. Because there is a zero tax on that object or service, the curve shows zero tax revenues being collected.
- POINT B: - Represents the end of the linear point. It should be noted at during the linear point, a percentage increase in the tax rate equates to a linear increase in taxes. Example, if you jump the tax from 1% to 2%, youll double your tax revenues. However, after this point, the tax rate becomes so high that the curve looses it linearity. Example, if you jump the tax from 5% to say 10% (way past the linear point), this does not automatically double the taxes received. Thats because the tax rate is now so high that people either begin to do without or figure out some other way of obtain the product.
- POINT C: - Represents the fall-back part of the curve. Thats the point where now taxes have become so high that people either cant afford the product OR simply figure out some way to go around the tax situation all together. Not that this was similar to what happened at point-B, but now so many people start doing that that tax revenues actually decline.
- POINT D: - Represents the point where taxes become so high, that no one uses the service anymore or resort to criminality to obtain it. In either case tax revenues fall-back to zero.
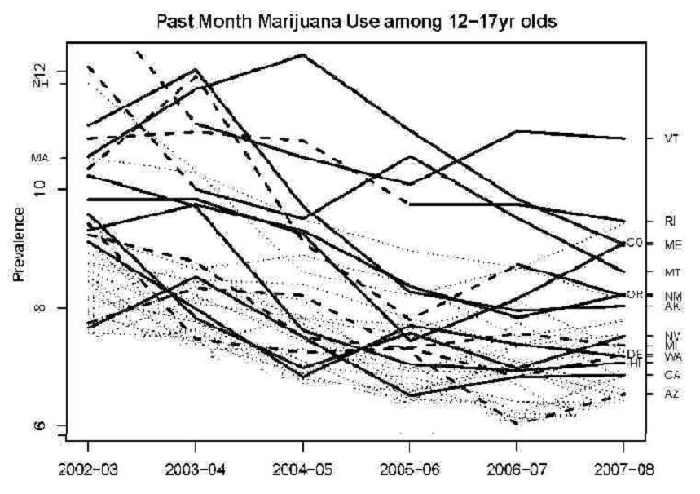
This chart graphs the bubble effect for each state as it legalized Medical Cannabis use. Note that the bubble brings the totals up for a period of time, but that it quickly bursts and then the overall numbers continue to drop.
True, there is a short-term rise, what is termed The Bubble Effect, which happens anytime something like marijuana goes from being illegal to being completely legal. People whove never used it before try it out to see what it was all about. But that doesnt last too long, and as can bee seen from the chart above, within two years the Bubble bursts and the number of users goes back to pre-legal days, after which it continues to steadily drop. Translation, legalization actually reduces the number of marijuana users. A situation that has been proven to be the case in country after country, in state after state . . . simply put the number of marijuana users can be expected to decrease, not increase.
Okay, point being made here is that, because the base keeps decreasing, one simply cant calculate tax revenues via older established methods. Even Colorado has kind of figured that out, and is relying more and more on out of state visitors for future growth.
For every action on the part of Government, there is an equal and opposite reaction on the part of the peopleOr putting it another way, if you raise taxes too high, you make it worth peoples time to go to another state with lower taxes.
Thus returning back to the subject at hand, we are forced to make use of a very, very conservative guess-tumate, based on our population, that of Colorado, and word of mouth estimates (via the grapevine) about Colorados domestic verses out of state buyers. That being $27,000,000 per year. Its probably way too low, but still were simply not Colorado. And if we are to error, let us error on the side of caution.
6.2 - PRISON INCARCERATION EXPENSES:
At the present time, with a total departmental budget (2015) of $582,886,000, we estimate that the total State Prison expenditures for Marihuana incarceration stands at around $43-Million dollars per year.
| AMOUNT | OVERALL TOTALS | |
| $43,000,000 | $60,000,000 |
METHODOLOGY
- According to Bobby Cleveland (a State representative, whose on the prison commission), we are spending $23,000 per state prisoner per year.
- According to our own head count (the complete prison records for Feb. 2014 were obtained via Oklahomas Open Records Act) approximately 6.5%* of our total state prison population would NOT be there if Marihuana were not against the law.
- At the present time (2017) we have approximately 28,700 prisoners in our State prisons. So after doing a little math.
Meaning it costing us just a little over 43 million dollars per year. Just to incarcerate people for Marihuana.
NOTE: Dividing the total Department of Corrections budget of $582,886,000 (2015 budget) by the total number of prisoners for that year (around 27,500) gives us a total of = $21,500 per prisoner per year so state representative Clevelands estimate is about right. However, it appears that left out of this equation is the physical brick and mortar of prison construction. AKA- State Bond Payments, which (budget wise) are treated separately. So we should see this as a conservative estimate of actual costs incurred.
WARNING: Note that this last figure was actually a TAX SAVINGS as oppose to an actual tax increase. Also, lets just get real. Does anyone really expect the Dept. of Corrections (et al) to simply say. . . Oh look we now that weve legalized were no long going to need this money anymore. Common horse sense dictates that theyll figure out some other need for it. But still, at least on paper it is a tax revenue increase.
* The figure 6.5% comes from two other figures. 4% of our entire state prison population are their solely for marijuana or marijuana related crimes. Meaning that if marijuana of-and-by itself was not illegal that they would not have even gone to trial. The other 2.5% comes from the fact that in addition to the already mentioned 4%, fully 11.5% of the total prison population is there with marijuana being one of their committed crimes. This 11.5% was pro-rated down to 2.5% solely for the marijuana part of their sentences.
6.3 - PARDON AND PAROLE BOARD SAVINGS:
At the present time we estimate that it is costing local and state the taxpayers approximately one hundred and fifty thousand dollars.
| AMOUNT | OVERALL TOTALS | |
| $150,000 | $64,150,000 |
METHODOLOGY
The (official 2015 budget for the Pardon and Parole Board was $2,466,681. And (as per our prison report) as 4% of our entire prison population is there solely because marihuana is illegal. Thus doing a little math:
$2,466,681 x 4% = $150,000
NOTE: This figure is way, way to low as many marijuana first time arresties (example, 28% of all OBN drug arrests are solely for marijuana) are not actually sent to prison but place directly on parole.
In addition, 4% of the part of the entire Department of Corrections budget ($582,886,000) is devoted toward probation and Parole Services.
6.4 - COUNTY COURTS, LOCAL POLICING EXPENSES:
Because the primary costs (at least on paper) incurred are local as opposed to statewide, and as this report deals with the State-wide budgetary affects of re-legalization, one is at first tempted to ignore these costs all together. However, after some second glances at just who is paying for what and why, it became obvious that the whole situation (costs incurred of running the local County Courts Houses and Policing) is so intertwined with our state budgeting as to be inseparable. Simply put, ending the arrests/harassment will not only (universally) effect ALL local policing authorities, it will also be reflected in our state budgeting. However, while the above statements are obvious the exact amounts involved are not. Once more weve have Oklahomas Opaque system of record keeping to thank for that. Simply put, there is no way of determining what funds are being spent on what. Which is why weve been forced to come up with a total guess-tument (thats right we admit it, its a total guess-tument) of some $43-Million dollars per year in direct tax savings.
| AMOUNT | OVERALL TOTALS | |
| $43,000,000 | $107,150,000 |
METHODOLOGY
In compiling this report, various attempts were made to determine EXACTLY how much state as well as local taxpayers monies were being expended as a result of marijuana law enforcement activities. Yet try as we might, all of them were determined to contain inherent inaccuracies, which null and voided their usage. However, we were able to obtain some statistics that we were able to put to good use.
According to Oklahomas own (2016) Uniformed Crime Report statistics:
For the whole year of 2016, there were a total of 119,179 individuals arrested in Oklahoma.
Of that figure, a total of 11,040 individuals (including 1,048 juveniles) were arrested solely on marijuana charges.
A factor that allows us to do a little math:
[ (11,040 marijuana arrests) / (119,179 total arrests) = 9.2% ]
Meaning that 9.2% of all arrests that year in the state were solely for marijuana related crimes. And the actual number is probably quite higher as uniformed crime statistics are usually tallied up (or classified under) the highest level of crime committed. Example: If a Cancer patient happens to have a handgun in his house while using medical marijuana, he will not be tallied up as a marijuana arrest, but instead as a weapons possession while committing a felony or something like that. But still, as its the officially given figure, lets just go with it.
This would meant that if we knew the exact figure for ALL OKLAHOMA policing/court costs (which we dont), we would be able to multiply that figure by 9.2% and obtain a rough ball-park figure as to the actual costs. But we dont exactly know what those costs are and given Oklahomas love of opaque record keeping, we probably never will. *
Other statistics also show the true nature of the problem. Once more as per Oklahomas own (2016) Uniformed Crime Report statistics:
For the whole of that year, only 17,7% of all crimes committed that year within the state were officially solved.** Meaning that statistically (given the number of marijuana arrests which was put at 11,040), there were more arrests for marijuana then there were for:
-
Murder (151)
Rape (643),
Robbery (671),
Aggravated Assault (5,353),
Burglary (2,386),
Motor Vehicle Theft (1,151),
And Arson (124) combine.
But they still dont give us a figure that we can plug in. Which is why the $43-Million dollar figure was chosen (after many frustrating days of trying to tabulate just court trail expenses solely because its the same amount as what it is costing us to incarcerate our state prisoners for marijuana. Is it correct, probably not, and probably much, much too conservative. However, (yet once again) this report believes in error-ing on the side of caution. And (truth be told) without all the proper (actual figures) of policing, court time, spent, any figure put down would be at best a guess-timent.
* In case youre going to try this yourself, dont just use local budgets at face value. Theres always a lot of add-ons that are made and dont forget to include state funding as well. But take it from us, the job is impossible. Whoever wanted to hide these things did a good job of doing it.
** To be fair, 40% of all violent crimes were solved, and its the non-violent crimes that skew the figure. However, the fact still stands that 9.2% of those arrested were solely for marijuana.
6.5 - DEPT. OF PUBLIC SAFETY:
The Department of Public Safety, is actually a catch-all for a whole lot of other sub-agencies, and controls everything from Oklahomas D.M.V. to our Highway Patrol. Thus it seems natural to assume that legalizing marijuana (which makes up 9.2% of all arrests here in Oklahoma) would lower policing, drug testing costs, etc. Certainly it will lower their budgetary needs. Which at the present time has a total budget of over $211-Million dollars per year. Of which we estimate $8.8-Million ($8,805,263 actually) of that will be saved by re-legalization.
| AMOUNT | OVERALL TOTALS | |
| $8,805,263 | $115,413,000 |
METHODOLOGY
The total budge of Oklahomas Dept. of Public Safety was (2015) $211,135,000. However, approximately 55% of that came from user fees and/or the Federal Government. So here we are solely making use of ONLY the actual (Okla. Tax) appropriations part of their budget which was $95,709,377.
Next as 9.2% of all arrests in Oklahoma are solely for marijuana, therefore doing a little math:
(9.2%) x ($95,709,377) = $8,805,263
Granted this figure (given the State Cops, the Highway Patrol, etc., is involved here) is in all likelihood way, way on the low side. Still it does provide us with a starting point, one that we can utilizes for future calculations.
6.6 - OKLAHOMA BUREAU OF NARCOTICS:
Much could be said about eliminating this whole department and replacing its legitimate functions with a Department of Health sub-department of one form or another. But be that as it may (keeping with the subject at hand and) utilizing our present set-up. It is our belief that the tax saving from this department alone will equal approximately $5,053,440 dollars per year.
| AMOUNT | OVERALL TOTALS | |
| $5,053,440 | $120,466,440 |
METHODOLOGY
As previously stated (Sec 4.2)
For the 12-month period between July 1, 2013, and June 30, 2014, the task forces reported a total of 1,523 drug arrests and 259 non-drug arrests for a total of 1,782 arrests. . . Meaning that (essentially) the bulk (over 85%) of those funds went into fighting the War on Drugs as oppose to violent crimes. Which (again as per the report), states that 28% of all those drug arrests were marijuana arrests.Thus of ALL total (both drug as well as non-drug ) O.B.N. arrests 426 (or 24%) of them were for marijuana. Next taking their total budget of $21-Million dollars (2015) and doing a little math:
($21,056,000) x (24%) = $5,053,440 in tax savings
WARNING: From a statistical standpoint, the O.B.N. provides a good example of many of the physical problems faced while composing this report.
- First note that we are NOT talking about generating new tax revenues, or something that we can spend on new schools or whatever, but instead only about tax savings. --- As if anyone really expects the O.B.N. to willingly cut back on its own budget by that amount. More likely, given the nature of governmental bureaucracies, they will simply find some other (new and improved) purpose to keep their budget as is.
- Next, some of the above monies mentioned are actually Federal Grant Monies (Sec. 4.2 - this report) which technically did not originate via Oklahoma taxes. However, these have already been tabulated as negative numbers in Section 4.2 of this report.
- Then there is the infinite question; Is the stated figure (in this case being $5-Million per year) a realistic one? The answer here if pretty much NO, and for the following major reason.
However, (yet again), this report, takes the stand that if we are to error, that we should do so on the side of caution. Thus our logic for sticking to the $5,053,440 in tax savings.
6.7 - STATE ATTORNEY GENERALS BUDGET:
According to the state budget report (2016) the total budget for the State Attorney Generals office was $47,556,000 dollars for the year 2015. However, it appears that a large part of that budget comes from sources other than Oklahoma taxpayers therefore we will make use of ONLY their actual state appropriations (being) $14,580,000. But in any case it appears that the savings (if any) will be very small. Which is why the amount saved (if any) has been set to zero.
| AMOUNT | OVERALL TOTALS | |
| $0 | $120,466,440 |
METHODOLOGY
Once more, we are forced to rely mostly on guess-timents, as oppose to real-world data. And it is a fact that our Past State Attorney General spent considerable time/funds fighting the State of Colorado in federal court over Colorados own re-legalization efforts. So obvious some evil is involved, however, as its legal staff would be working there (with or without the marijuana laws), and as there office expenses/staff overhead would remain the same. It therefore becomes almost impossible to pin down an actual monetary number. Thus the logic for stating zero dollars as our amount.
6.8 - DEPARTMENT OF HUMAN SERVICES // CHILDREN AND YOUTH COMMISSION:
Although technically two different departments, due to the way our state has structured the Foster Care System (for the purposes of this report) both departments are being combined.
D.H.S. (Dept. of Human Services), also commonly known as the Welfare Department had a total 2015 budget of well over $2.4-Billion dollars. Note thats Billion not Million. However, only $674,870 of that amount came directly from Oklahoman taxpayers (the rest coming from Federal funds, etc). $384,000,000 (16%) of there total budget goes into what they term Child Welfare Services, which in turn controls and runs the Foster Care System.
The Children and Youth Commission (OCCY) in turn has a total budge of $3.2-Million dollars, of which $2.1-Million comes from the Oklahoma taxpayers. -- Of this budget:
DEALING WITH FOSTER CARE:
At this point the horror stories about the Foster Care System are well known. These news headlines say it all: [18]
YOUNG MOTHERS PARENTAL RIGHT TERMINATED FOR SMOKING MARIJUANA
EVEN IN LEGAL WEED STATES, PARENT WHO CONSUME POT CAN STILL LOSE CUSTODY OF THEIR KIDS
FOSTER CARE CHILDREN ARE WORSE OFF THAN CHILDREN IN TROUBLED
When asked, Oklahomas D.H.S. stated as follows:
DHS does not have an official policy concerning marijuana. Having said that, any report to DHS meeting statuary criteria of abuse and neglect, will be accepted and investigated and would include reports in which substance use was a contributing factor to the abuse or neglect of a child.Which in Oklahoma talk is another way of saying; --- That they WILL and will do so at the drop of a Hat, a situation that brings up a lot of interesting as well as moral questions. However, this report, by definition must limit itself solely to the monetary issues involved. So the question here becomes; How much is it costing us to incarcerate (or place into Foster Care if you will), the Children of anyone unfortunate enough to have been caught with marijuana?
The answer is simple, we dont know. And in this case as the two departments listed above keep using the excuse of we have to protect the privacy and rights of the children involved as reasoning for not wanting to talk to much about the matter, were probably never going to know. However, despite this, we have been able to obtain some general statistics that do give us some hints about whats really going on.
According to Oklahomas State of Change Annual Report (2013), there were:
Now, referencing to the following table (provided by Cornell University); NOTE that it centers around the number of children placed into Foster Care (2012) with/from alleged Drug Abusing parents.
| Drug Abuse Parent | 1,674 |
| Alcohol Abuse Child | 7 |
| Drug Abuse Child | 16 |
| Disable Child | 3 |
| Behavior Problems | 4 |
| Parent Death | 0 |
| Parent Jailed | 199 |
| Caretaker Cannot Cope | 11 |
| Abandoned | 60 |
| Inadequate Housing | 306 |
| Relinquishment | 3 |
| Physical Abuse | 120 |
| Sexual Abuse | 56 |
| Neglect | 819 |
| Alcoholic Parent | 134 |
Using two of these statistics (even if theyre from two different years) gives us the general percentage of just how many children are being entered into the Foster Care system from Drug Abusing Parents.
[ 1,674 (2012 figure) / 5,513 (2013 figure) = 30% ]
Thus it appears that roughly 30% of ALL Oklahoman children placed into Foster Care are the result of so-call Drug Abusing Patents. But just how many of those actually involve Marijuana instead of actual Drugs? And what are the actual costs of maintaining them there?
The answer to both questions is that WE DONT KNOW, and due to Oklahomas very opaque (very hidden) methodology of record keeping, at this time theres simply no way of finding out. Always when questions are asked, the old excuse of, We need to protect the identities and the privacy of the children comes into use.
Thus about all we can do is take a good technical guess-timent, but with a total budget in the billions of dollars, even that becomes an impossibility. Thus about all we can do in this case is to make note that there is some unknown figure out there that needs to be added-on to our Over-All-Total Amount. Which is why the PLUS sign is now being added to the Overall Totals calculated figures.
| AMOUNT | OVERALL TOTALS | |
| $ Unknown | $120,466,440 (plus) |
6.9 OKLAHOMA STATE SPONSORED HEALTH CARE COSTS:
With reference to the following agencies:
- Office of Disability Concerns (2015 total budget of $472,000) Oklahomas tax portion being $300,000.
- Health, Department of - (2015 budget of $389-Million) Oklahoma portion being $60,632,000.
- Mental Health & Substance Abuse - (2015 total budget of $464-Million) Oklahoma portion being $344-Million.
- etc.
A figure that was calculated is as follows:
By going over old (pre-Reefer Madness era) pharmaceutical trade price/product catalogs, we find that a pound of high quality Medical Cannabis soled back then (1931) for between $1.80 to $2 dollars per. However, that was way back then (very literally) in the heart of the great depression when a buck was worth a lot more than it does today.
Now, one is tempted to simply figure out inflation and voila! But that wont work in this case. Said reason being, that Medical Cannabis is a commodity and as such, pricing is subject to a variety of different factors; weather conditions, number of other farmers growing it, etc. . . so normal inflation indexing wont work in this case.
What was done therefore was to (along with Medical Cannabis), look up the prices of a series of other medical bulk herbs sold openly back in 1931. Herbs such as Parsley, Passionflowers, Peppermint, Rhubarb (which has medical uses), Cascara Saqrada, etc. Next, we took note of what these same Herbs were selling for today. Note roots were compared with roots, leafs with leafs etc.] --- Next, doing a little math, [dividing the present day price, by the 1931 price], I came up with a cost increase rate of between X-18 [low end] all the way up to X-50 at the top end.
Thus (using worst case scenario), as one-pound of Cannabis was selling for $2 dollars back than, and taking a multiplication factor of x50, we were able to calculate the [wholesale price] of Cannabis today as being $100 dollars per pound.
WARNING, the reader should note that this figure was tabulated some 15 years ago AND that wholesale NOT retail prices were being discussed. Under present day conditions (if all laws were returned to 1931 standards) the true retail costs will probably be more like $200 per pound.
Next, lets calculate the total medical costs per patient. As the average medical patient requires a dosage once every two to four hours (assume waking hours) and as the average medical patient requires an dosage of between 1/10 to 1/2 of a standard size tobacco cigarette. That would mean (worst case) that that patient will require a total of 4 cannabis cigarettes per day. Or
&nsbp; &nsbp; &nsbp; &nsbp; (365 days per year) x (4 cigarettes) = 1,460 cigarettes per year.
Now (right or wrong) referring tobacco cigarettes which weigh .05 pounds per pack of 20, would mean:
&nsbp; &nsbp; &nsbp; &nsbp; (1,460 / 20) x .05lbs = 3.65 pounds
Thus, we can say that the average medical marijuana patient will require less then 4 pounds of Medical Cannabis per year. Or [4 x $200 = $800 dollars per year MAX] Now lets look at the costs of Medical Marijuanas closes competitor MARINOL, a synthetic (yet presently legal) form of marijuana.
. . . After all is said and done, MARINOL IS EXPENSIVE, very expensive. Don't believe me, check it out for yourself, I just got back from my local Safeway Supper Market/drugstore, which sells 60 pills (10mg each) for a discounted price of $1,400 dollars. And that's only a 30-day supply or the equivalent of just 120 Medical Marihuana cigarettes or 1/20 of a pound.*Here we wont follow up on the math, as we hope the reader gets the general idea. From a moral standpoint, what is the phony-baloney that marijuana is not medicine, when a synthetic (if very expensive) form of it can be bought in a drug store. But be that as it may, the only point being made here is that Oklahomas indigent health care costs are going to go way down.
NOTE:
Here the reader should take note of the fact that the exclusive patent rights to Marinol have long ago gone away and one can obtain a generic Dronabinol for about 1/3 the price of Marinol. However, the cost differences are still obvious. In addition, Medical Cannabis has so many medical uses [18], it quickly becomes evident that it will began replacing Big Pharma products immediately. Something that in turn will lead to (be they big or small) cost savings to Oklahoma taxpayers.
However, trying to pin down an exact number, given the limited amount of data (relating to exact illnesses being treated), prevents any kind of exact financial number from being tabulated. Thus we must simply treat it as part of that PLUS figure found at the end of the OVERALL TOTALS.
| AMOUNT | OVERALL TOTALS | |
| $ Unknown | $120,466,440 (plus) |
6.10 SECTION SUMMARY:
The overall purpose of this report is to determine the economic impact the marijuanas re-legalization will have on state finances. Specifically to those financial issues effecting (positively or negatively) state tax revenues. So far this report has tabulate:
- $10,000,000 dollars (in new expenditures), will be needed (sec 4) to finance state revenue collections, agriculture monitoring and reviews, as well as to account for lost federal eradication grant monies, civil asset seizures takes, etc.
- $27,000,000 dollars in new tax revenues that will be generated from special sales taxes, etc.
- $103,466,440 (plus) in direct tax savings to the state. These coming from saved court, criminal, prison incarceration costs, etc.
WANT TO KNOW MORE:
=====================
Due to space / download time considerations, only selected materials are displayed. If you would like to obtain more information, feel free to contact the museum. All our material is available (at cost) on CD-Rom format.
CONTACT PAGE
 BUDGET REPORT PRIVIOUS SECTION |
 |
 BUDGET REPORT NEXT SECTION |
 BACK TO MAIN PAGE OKLAHOMA BUDGET REPORT |